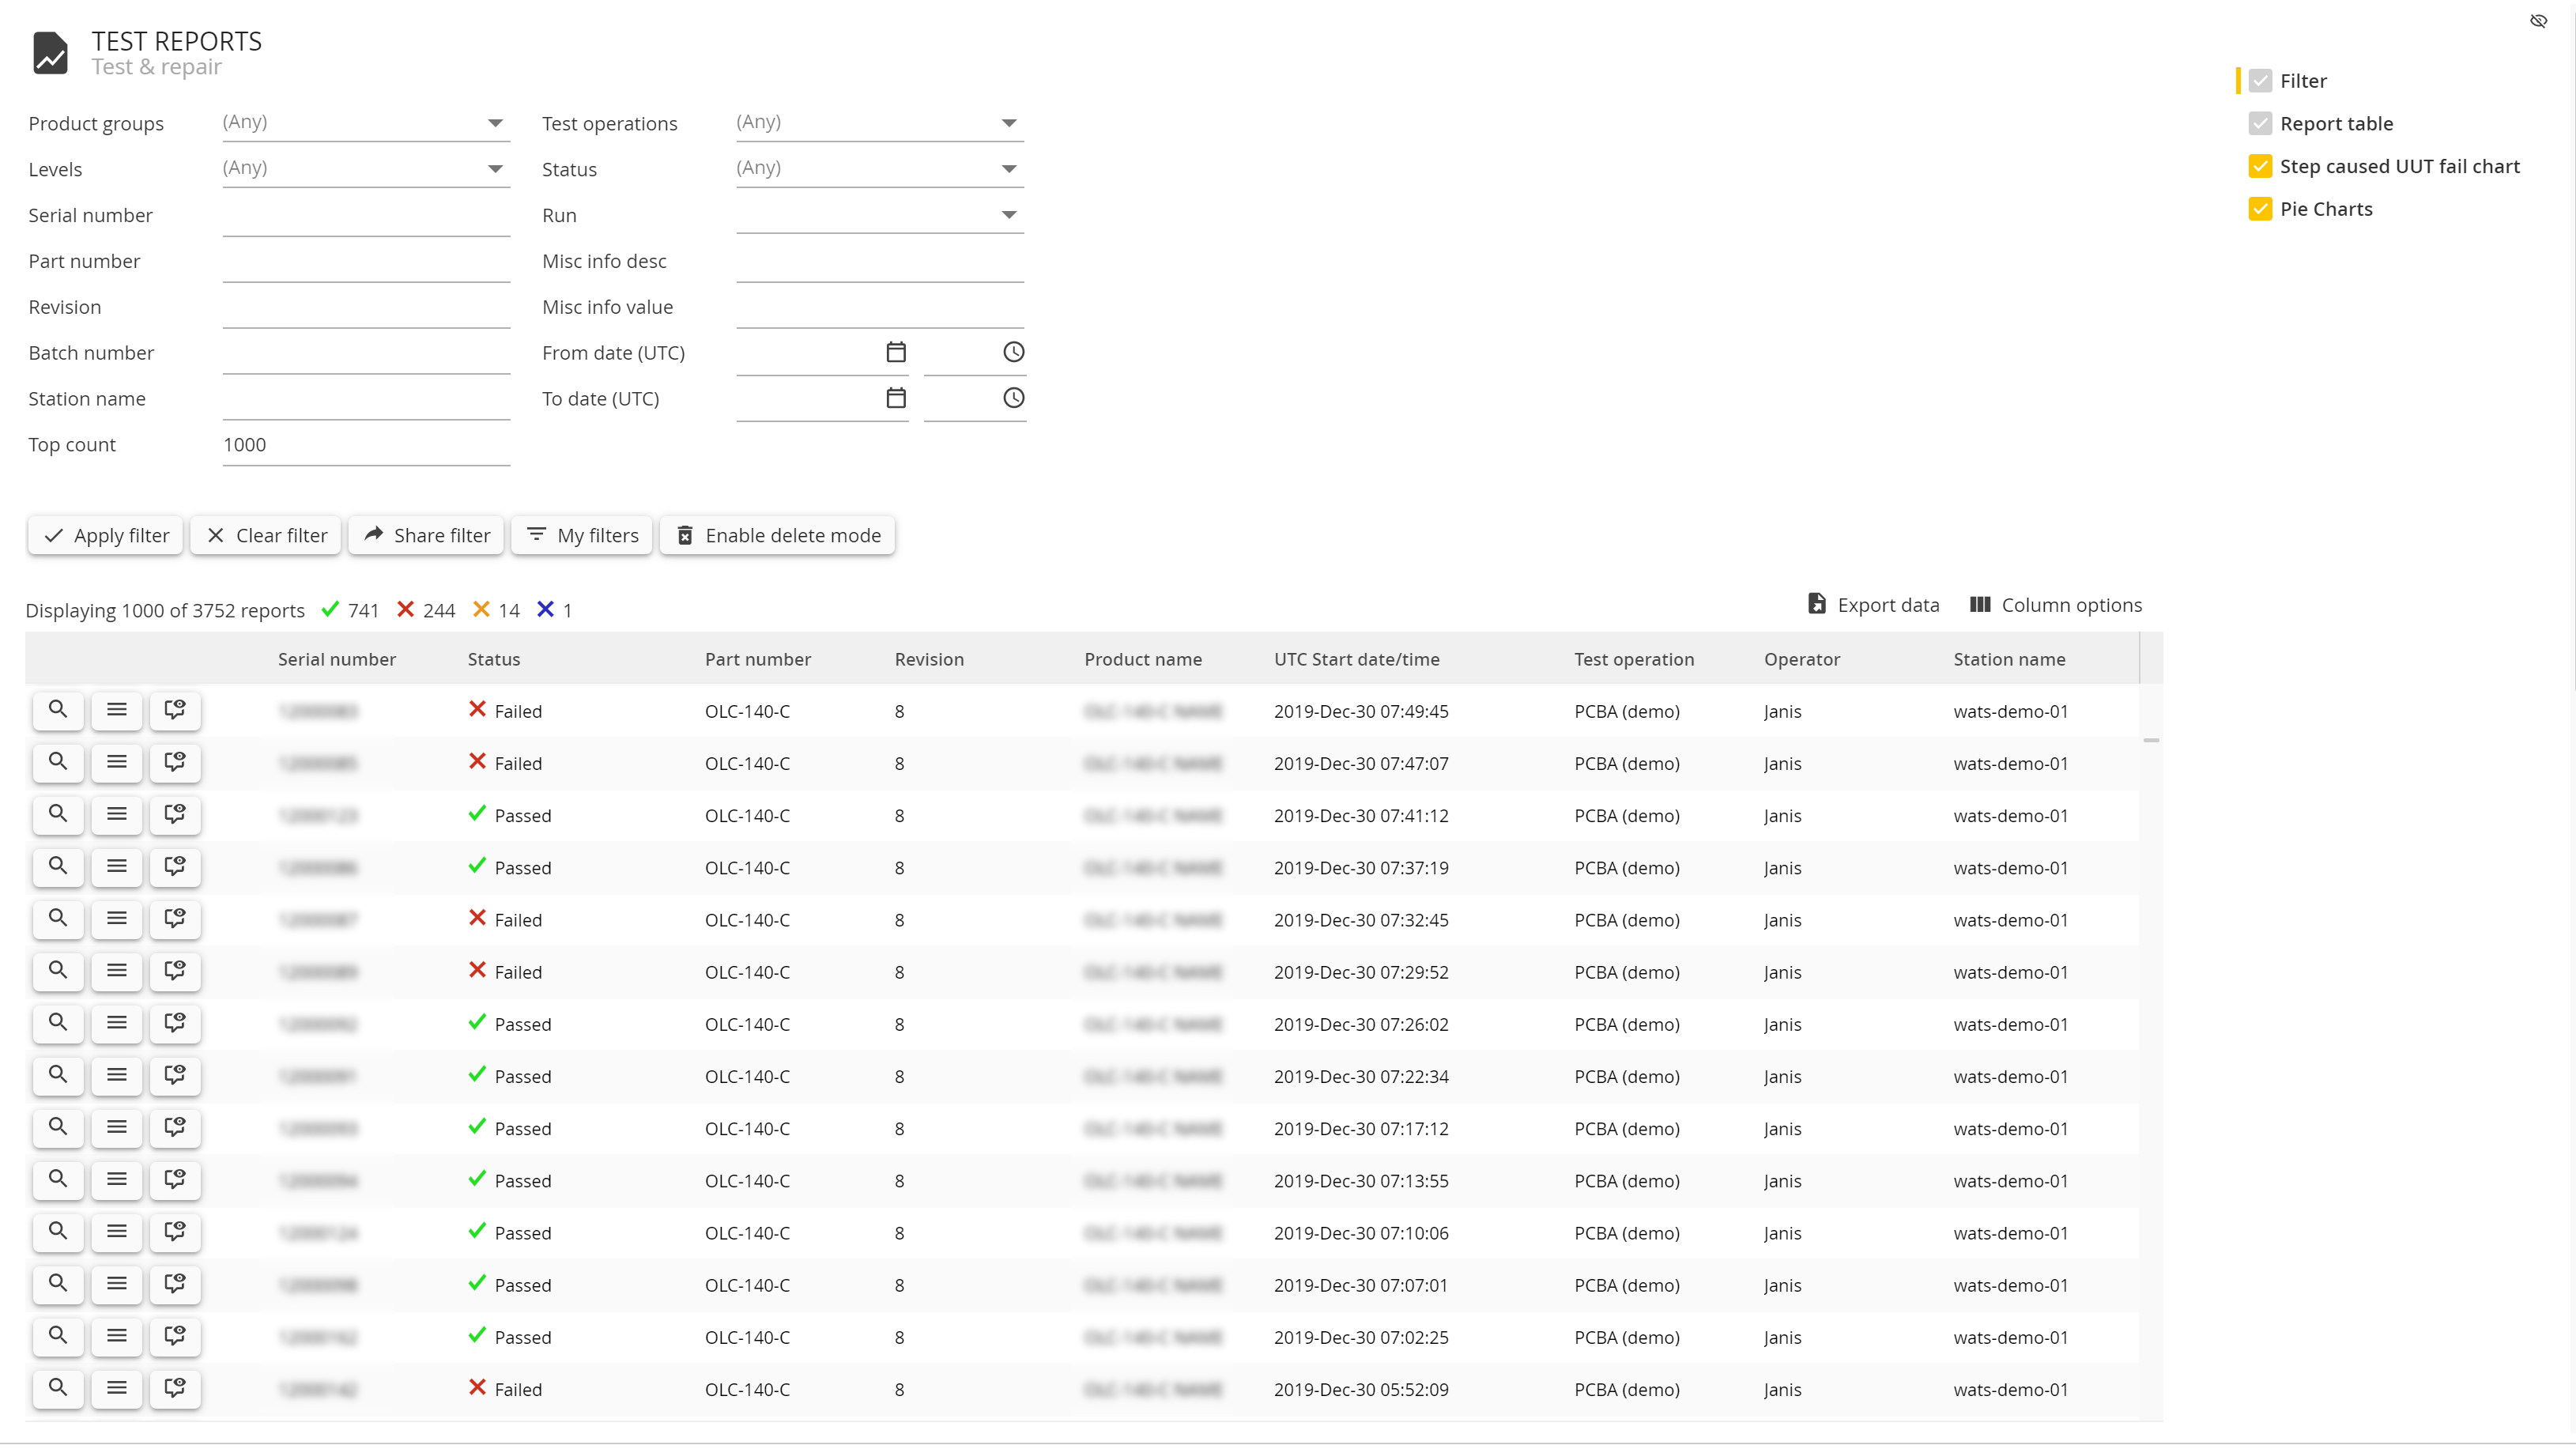
As soon as a UUT report is logged from a WATS Client, Manual Inspection, RestAPI or similar, it will show up in the test report list as UUTs. By default, the most recent report is at top of the list.
Filter
The article Using the report filter describes report filter in details. Use the filter options to narrow your search, and click Apply filter to run the report.
Test reports grid
After applying the report filter the grid will be populated with Test reports (UUTs) matching your filter. Click the magnifying glass icon  in the grid to view a UUT report.
Charts
Test reports have set of charts that provide basic analysis of the data set displayed in the grid.
Step caused UUT fail
The step caused UUT fail, shows an ordered bar chart of the top 10 failing steps. By hoovering over a bar you can see details about the step. If you have more then 10 failures in your data set these are summarized in the bar Other.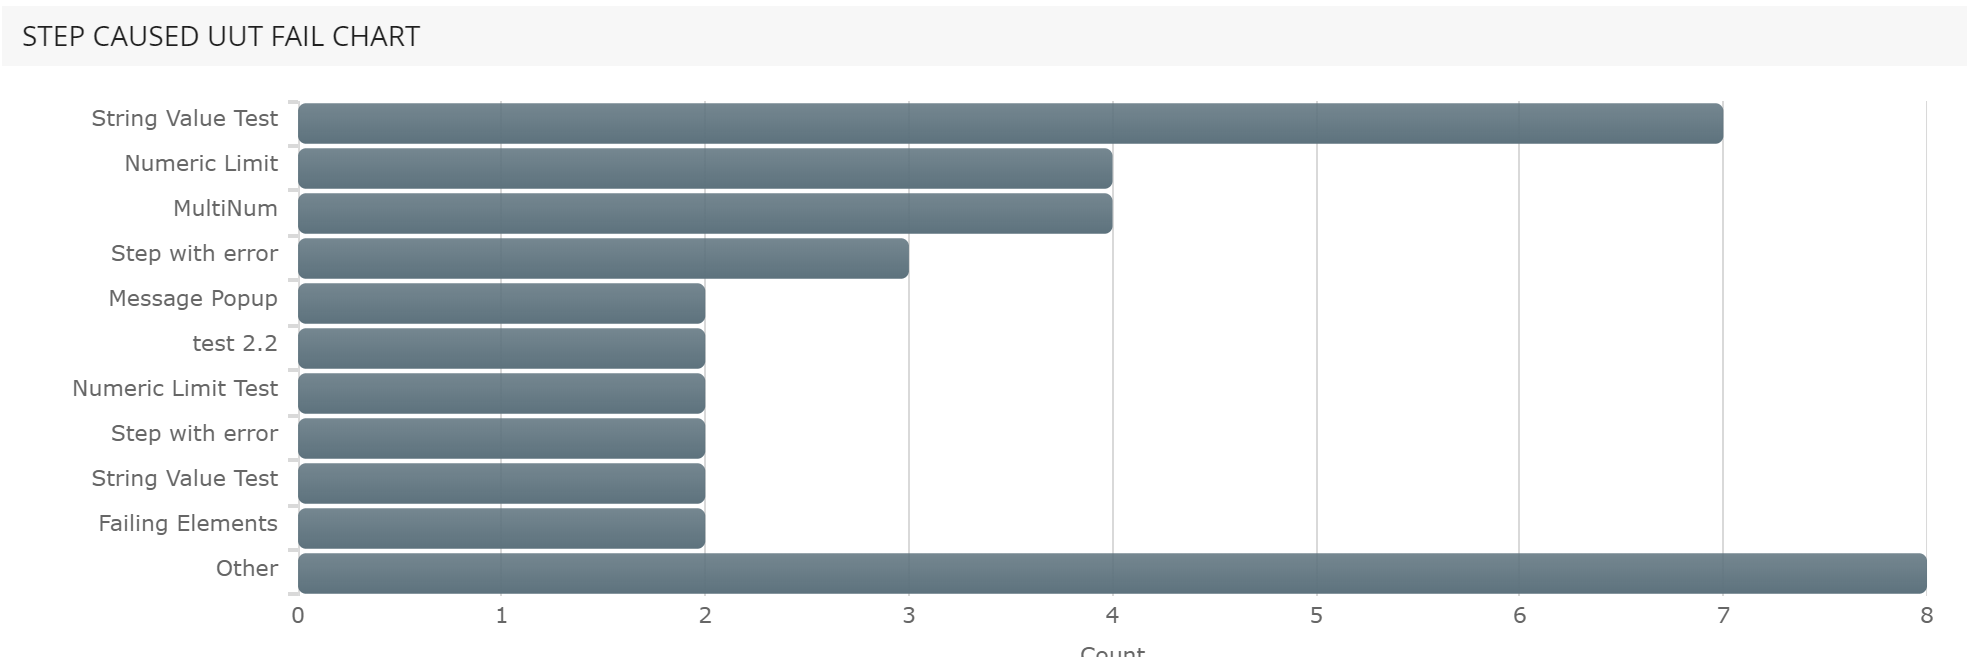
Pie chart summary
In the pie-chart summary you can inspect the distribution of reports, based on the parameters: status, test operation, part number, station name, operator and location.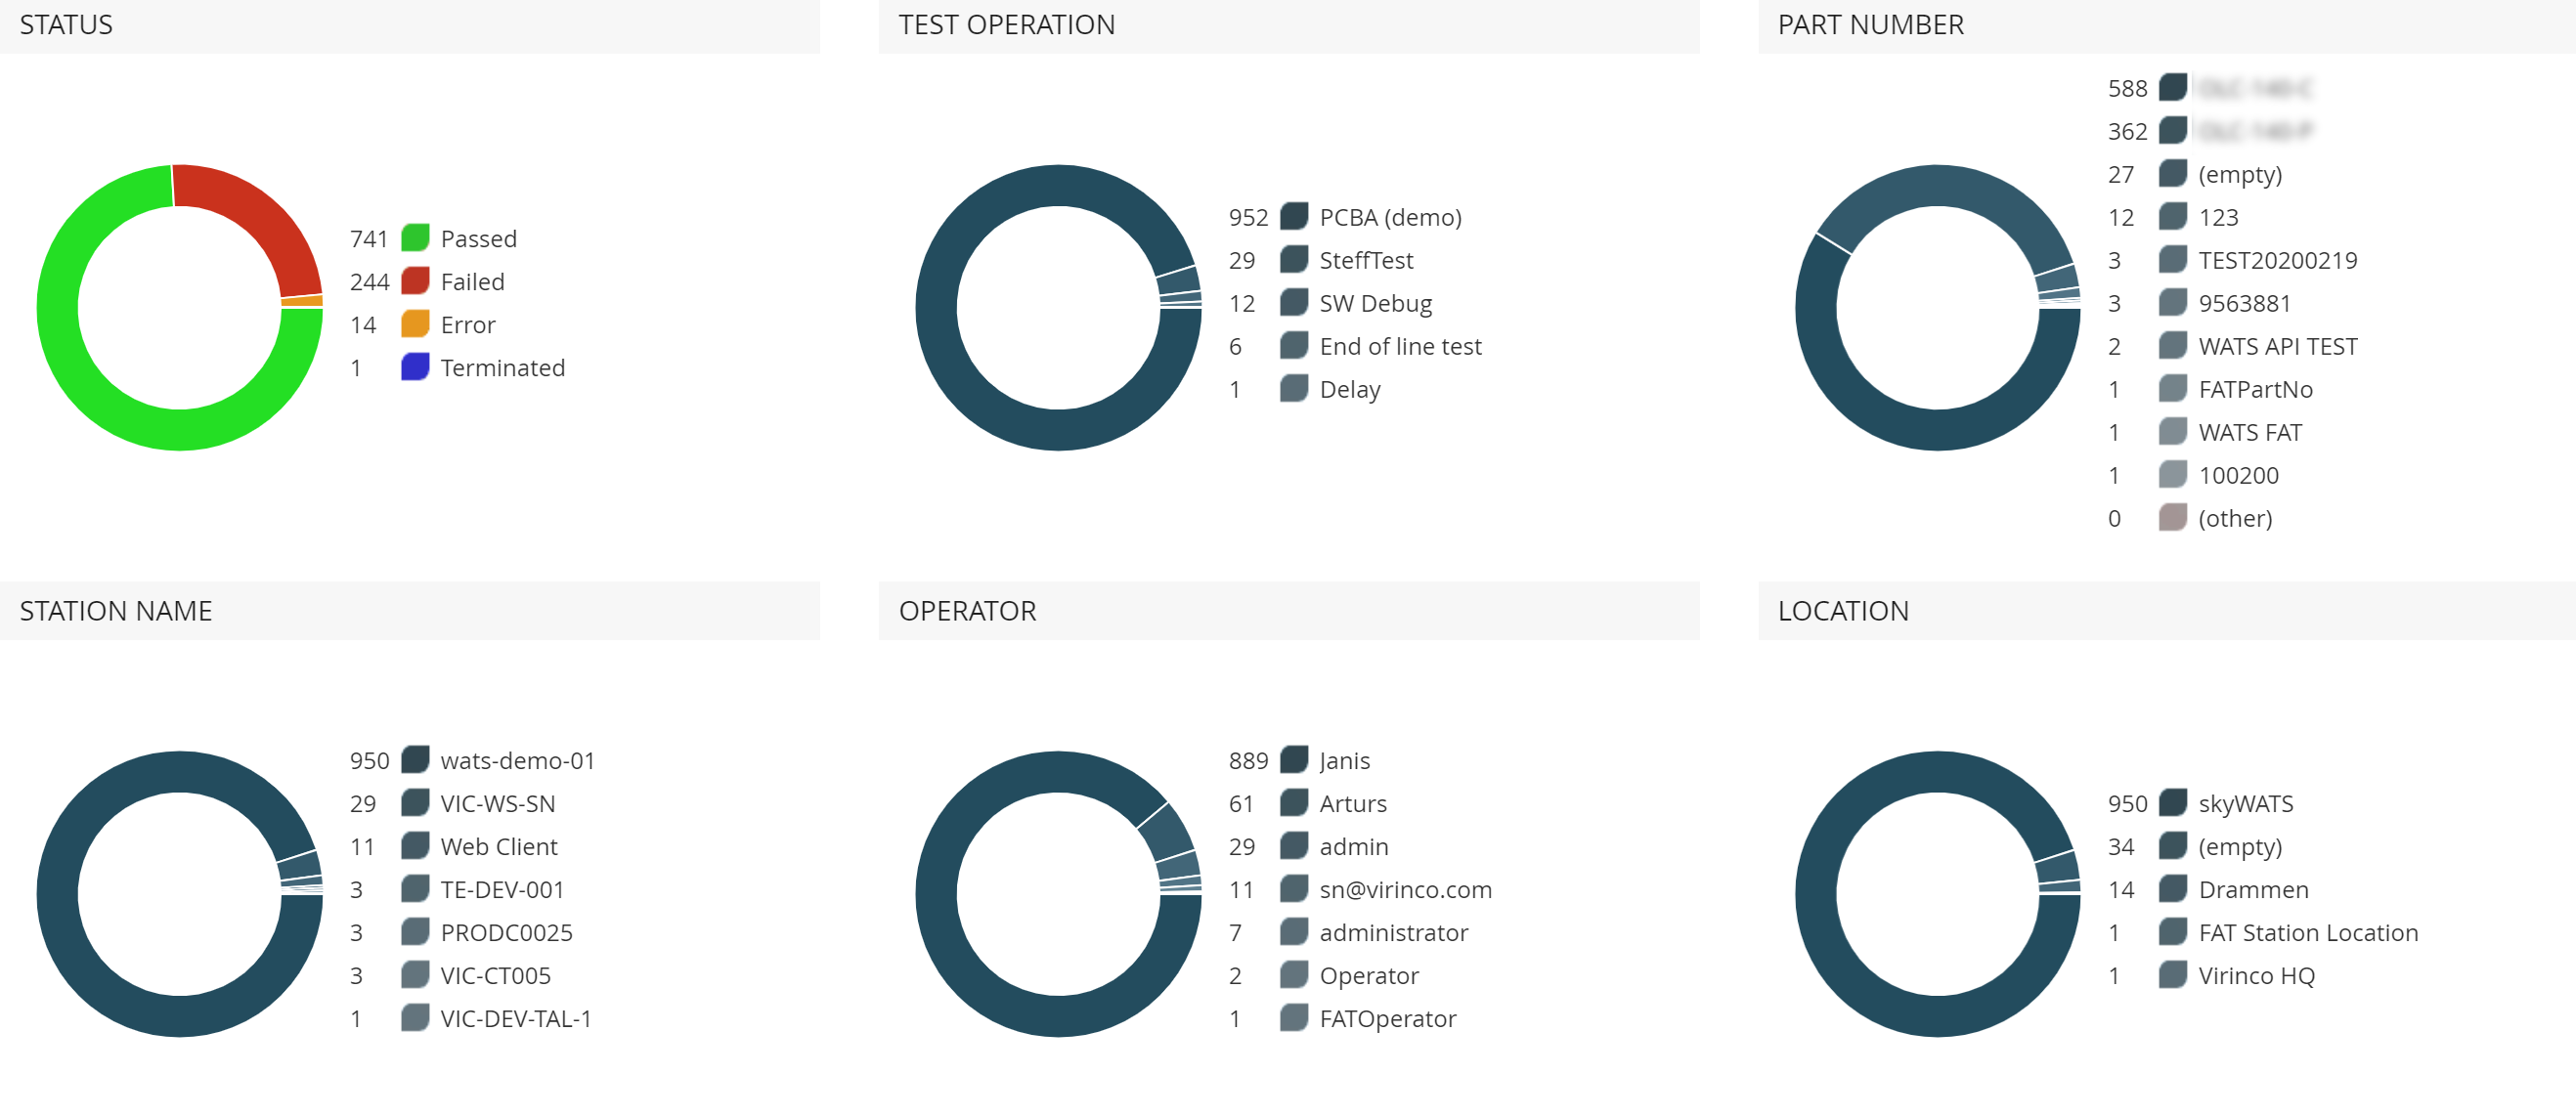
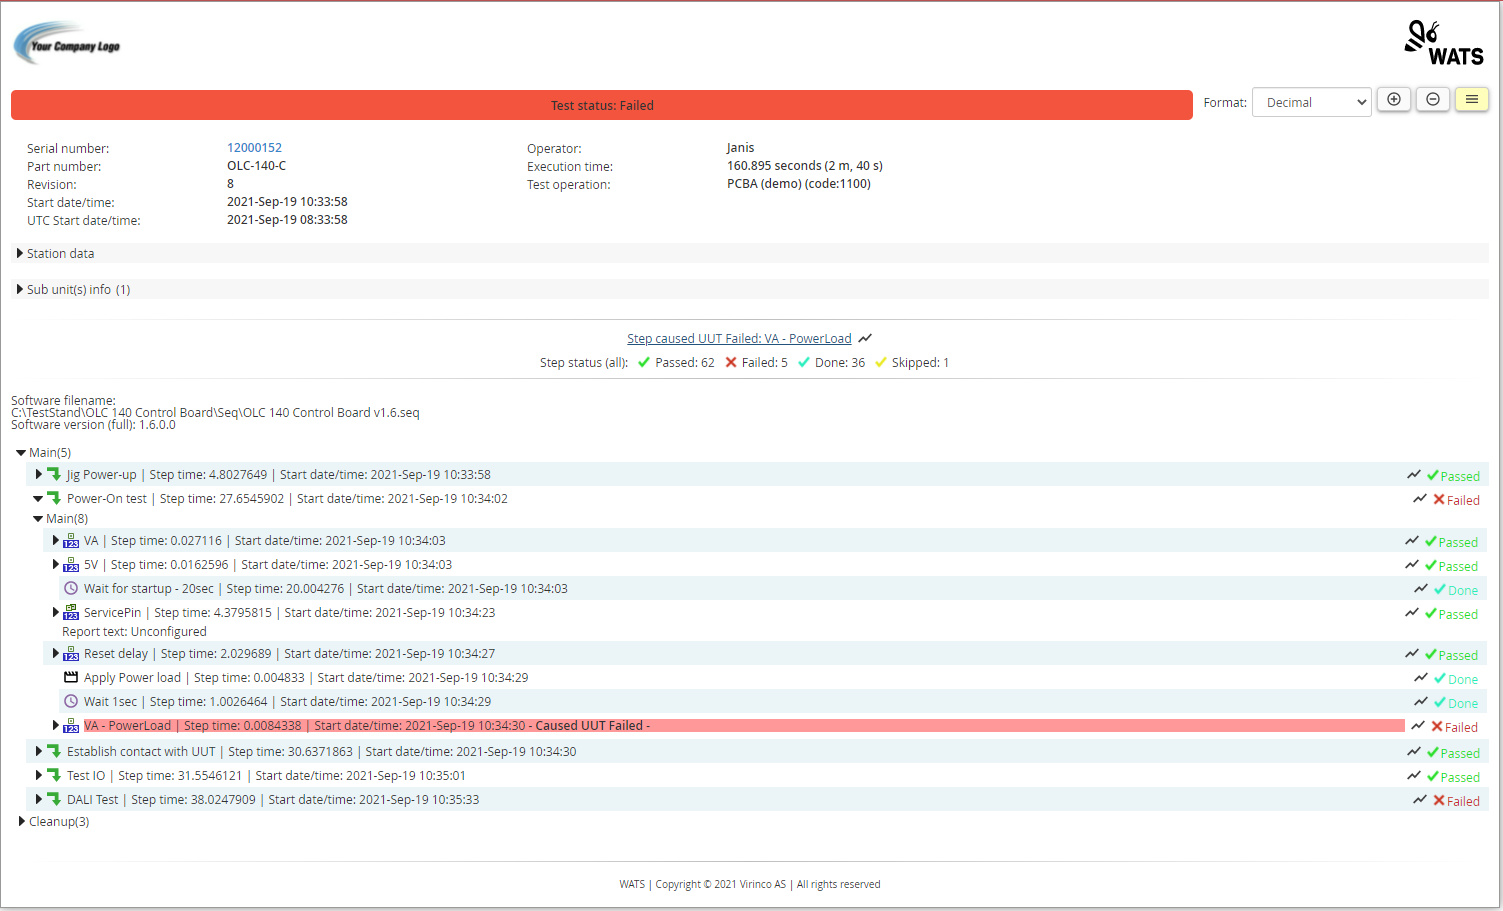
UUT Report
By the magnifying glass icon  in the grid, you can view the UUT report. The report consists of a report menu, report header and the step list showing all sequences, steps and measurements of the test sequence.
 Report Header
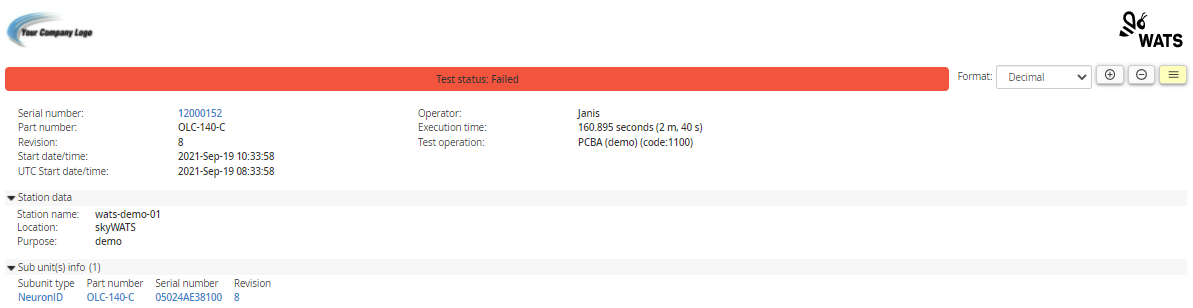 In the header you will find information regarding the serial number, part number and revision, as well as the date and time, execution time and operator. The header will be formatted with colors representing the report status.
By clicking the serial number you can access the full serial number history for this unit. Expandable header section are dedicated to station data, sub units and misc.info. Sub units are displayed as links taking you to the serial number history of the sub unit.
Step Status and Failed Step
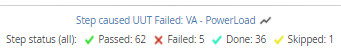
The step status area displays the number of steps and their status. If the inspected report has failed, this area also contains a link taking you to the step that failed the report.
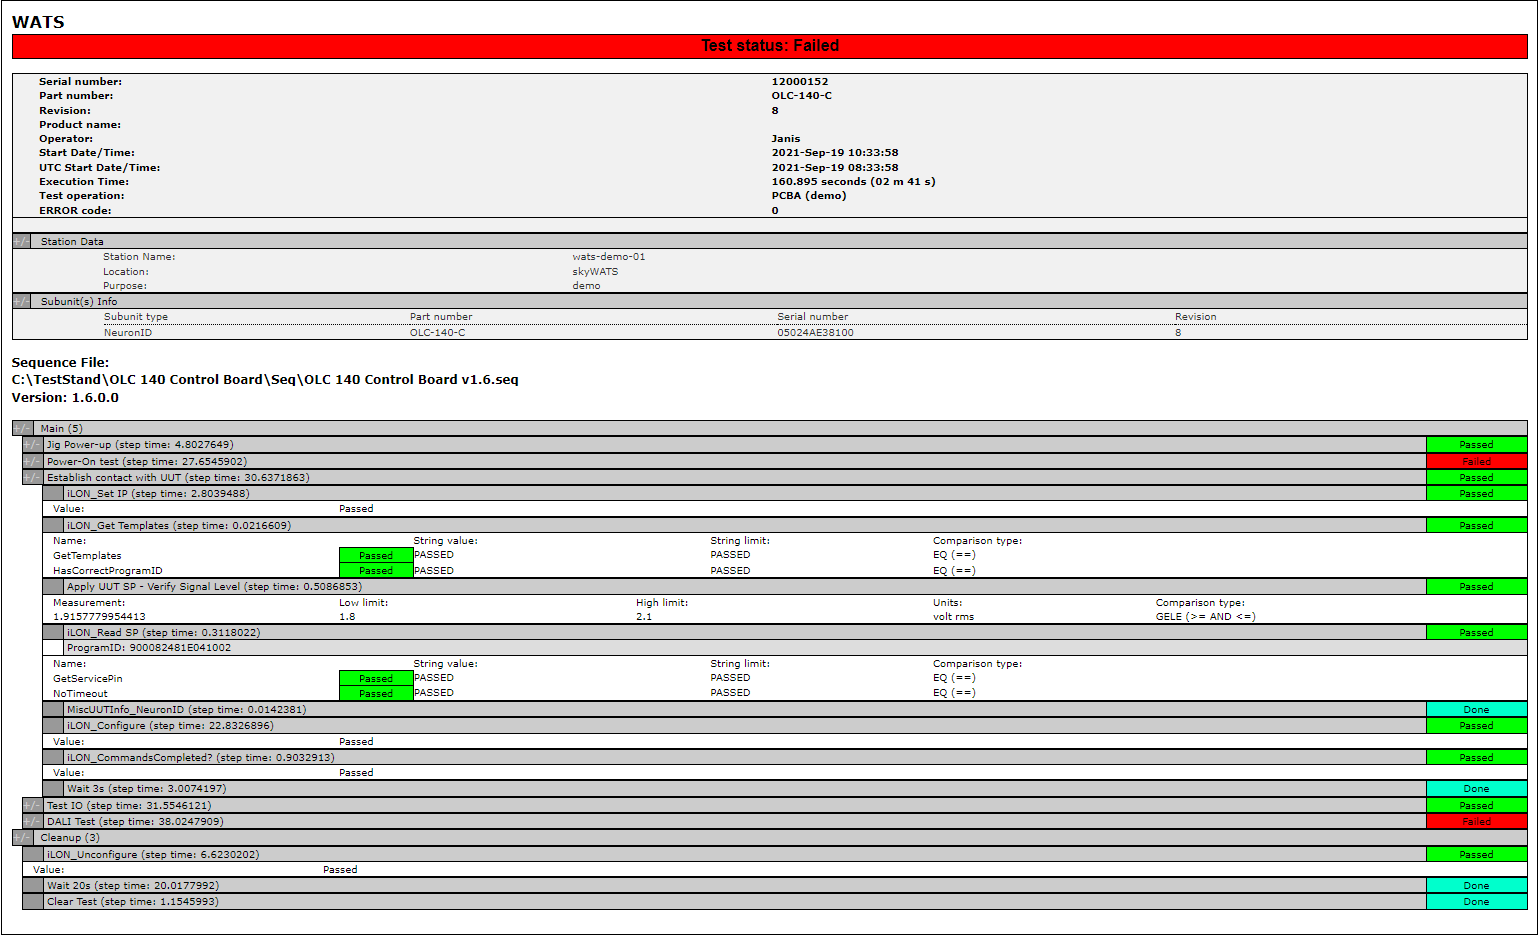
Step List
The step list shows a expandable view of the test sequence. You can use the + and - icons in the report menu to quickly expand or collapse all steps. Expand or collapse rows by clicking the row.
Each row in the step list shows a step-type icon to the left, the step name, execution time and start time. In addition you can se the steps status and a link to the step details view  to the right.

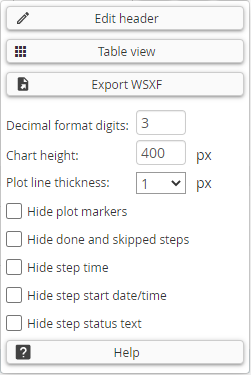
Report Menu
The report menu in the top right hand corner provides a drop down for selecting number format. Icons (+/-) lets you quickly expand or collapse all steps of the step list and a menu button  provides a pop-up with more tools and option.
Numeric formatting
You can set the default numeric formatting in UUT Report menu bar, in the upper right corner of the report. The chosen format is stored in the database on a per user basis. WATS do not collect the formatting details from TestStand.
Edit Header
Click on the button and the report will change to edit mode (header). When finished, click on the "Save changes" button.
 NOTE: You must be granted access to Configure/Settings > Update UUT Report by the Administrator (Roles & Permissions)
Table View
The menu option Table view lets you view the report in a table format.
Export WSFX
Lets you export the report as a WSFX (WATS Standard XML Format) file.